If you’re like me, by the time I teach students to graph rational functions in Algebra 2 I felt like a broken record.
- Need the y-intercepts? Plug in 0 for x.
- Need the x-intercepts? Set the equation equal to 0.
- Need the asymptote? Determine the undefined values.
And on and on it went, the same story for every function we studied. So, I decided that my students should do a discovery lesson to introduce the topic of graphing rational functions. What would they be discovering? Well, first how to graph a rational function, and second that they knew most of the information already!
Why is Graphing Rational Functions So Hard?
Rational functions have several characteristics that need to be known in order to graph them, more than most functions students have studied up until this point. Students often get lost in all the steps and feel like they have to memorize them instead of relying on their mathematical intuition.
- x-intercept(s)
- y-intercept
- horizontal asymptote
- vertical asymptote
- Holes
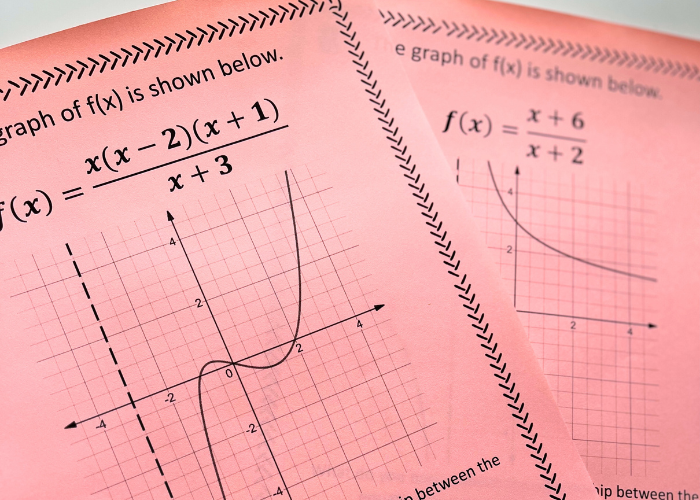
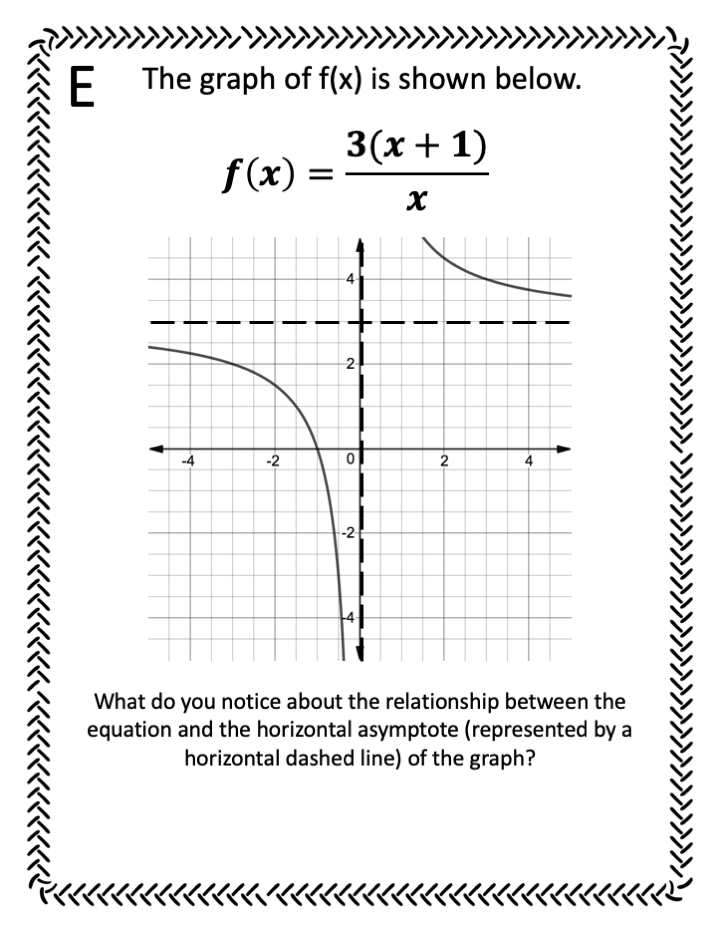
First, students should know how to find the intercepts from their studies of other functions, such as quadratic functions and linear functions. Second, students should be able to look at a factored form equation and recognize where a hole appears (see that factor in the numerator and denominator? yeahhhh!!). Third, when pointed out to them, students should notice the relationship between the horizontal asymptote of the rational function and the coefficients of the equation.
I decided that trusting my students (or at least a few in each group) to notice these patterns made for a FAR MORE ENJOYABLE lesson than me droning on and on about plugging x in for y and solving the equation (for the hundredth time this year, seriously!) So, I made a gallery walk with a poster for each characteristic of the graph.
Want access to my FREE resource library? Click here to join!
How the Lesson Works
Students walk around (a body at rest is a mind at rest) and make observations at each station. Maybe they figure out the punch line (the vertical asymptotes are just the zeros of the denominator 🤯) or maybe they just notice something that they wouldn’t have otherwise. Either way they’re out of their seat, thinking about and talking about math. Yes, please!
Once they’ve all had a chance to walk around and fill out an “I notice, I wonder” sheet, we meet as a whole group to fill out the summary page. Here is where the students can shine by sharing their discoveries with each other and me. I guide them through by filling out a copy of the summary page on the board.
Where Can I Get This Lesson?
This lesson is for sale on my TpT store and includes:
- 7 stations
- 1 gallery walk worksheet
- 1 summary page
- 1 answer key
Let me know if you use this in your classroom and let’s continue the conversation in the comments, on IG @mathymrs.j, or through email!
Natasha