A long time ago, in 2012, I was a brand new teacher and would scour the internet for math project ideas. I came across a blog post describing a project for graphing absolute value functions and ended up using it nearly every year of my teaching career since! I can’t remember who originally wrote the blog post, or I’d give credit, but here is how I’ve implemented the project in my classroom.
Absolute Value Project Description
The thing about absolute value functions is that their applications are limited. You only use them when working with distance or other applications where the output is only positive numbers. This project works because students will be collecting guesses, the input variable, and determining how far off the guess is (a positive distance) as the output variable.
Introducing the Project
I tell students that they’ll be surveying people. They can ask anyone; family, friends, teachers, etc. Their question must have a numerical answer, and while there are lots of questions they could ask, some are better than others.
No personal questions. For example, “how many seats are there in Yankee Stadium”?” is better than “how many pairs of shoes do I own?” Highly personal questions are hard for people to answer, especially if they don’t know you very well. They are also hard to verify if they’re correct.
No questions with very low answers (like 1 or 2). If you ask “how many times has Kim Kardashian been married?” there will be a very small left “branch” on your graph, because no one will guess negative values.
Avoid very niche questions. I want student to pick a question that they care about but it also needs to be a question that people can answer. “How many books are in the [very obscure] book series?” is a hard question to gather good data for.
There must be a correct answer. You can’t ask “what’s your birthdate?” because then you can’t calculate the y value, how far off the guess is from the correct answer.
Collecting Data
I require students to collect at least 30 data points (i.e. survey 30 people). They can, of course, do more than that if needed. They record the name of the person as well as their guess in a table that they will be required to turn in along with their poster. I give students about a week to collect the data.
Finish the Project
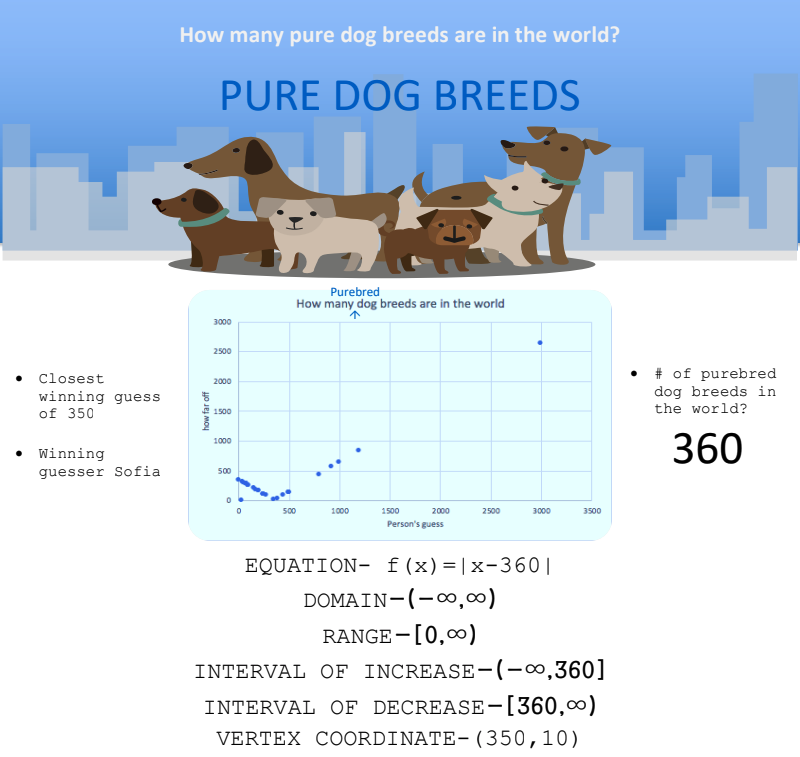
Students turn in a digital poster with the following:
- A graph of the data (x is guess, y is how far off the guess is from the actual answer)
- The vertex of the function that passes through the data
- The domain of the function that passes through the data
- The range of the function that passes through the data
- The equation of the function that passes through the data
- The winner (who guessed the closest)
Grading the Project
Click here to gain access to my FREE library of resources, including a rubric for this project!
I hope you and your students love this project and that it provides some real-world context for absolute value functions!
Let me know if you use this in your classroom. I’d love to continue the conversation in the comments or in IG @mathymrs.j
Happy teaching!
Natasha
Thank you so much for this, Mathy Mrs. J.! You’re the best ever. Keep the dream alive! Sincerely, Michael L. Werth, Providence, RI
Thanks, Michael – I hope your students love it!