In 2013 my district adopted new curriculum that was very closely aligned to the (then) new Common Core State Standards. I read these words as a standard I needed to teach:
Buy the lesson comparing linear and exponential functions!
The textbook we had adopted used the example of simple and compound interest. We’ve all seen it right? Simple interest adds a constant amount to the bank account, and compound interest adds a percentage of the balance, including any previously earned interest. Great, amazing…except who has ever ACTUALLY had a simple interest bank account? Not me. I’ve never even heard of it outside of a math problem, and that just rubs me the wrong way. Fake real-world situations are my mathematics pet peeve.
A Non-Fake Real World Example
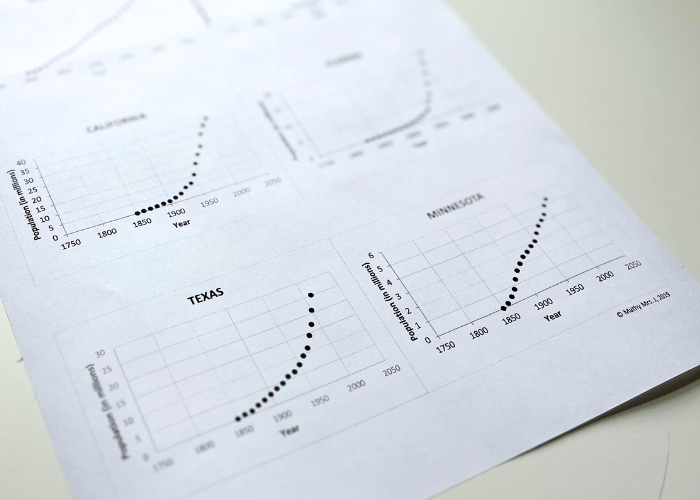
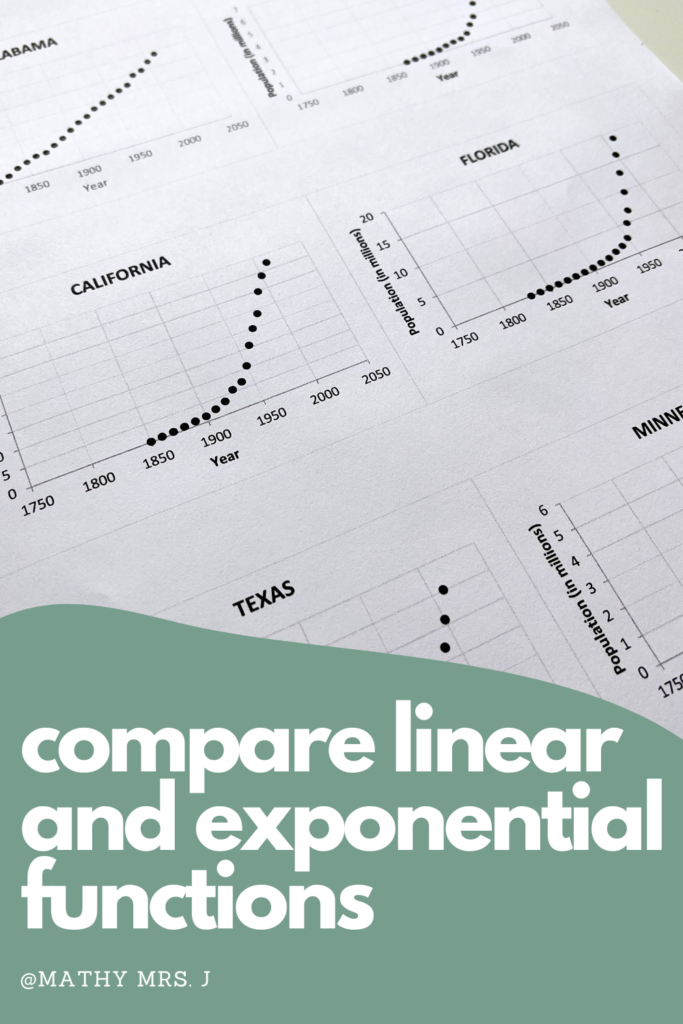
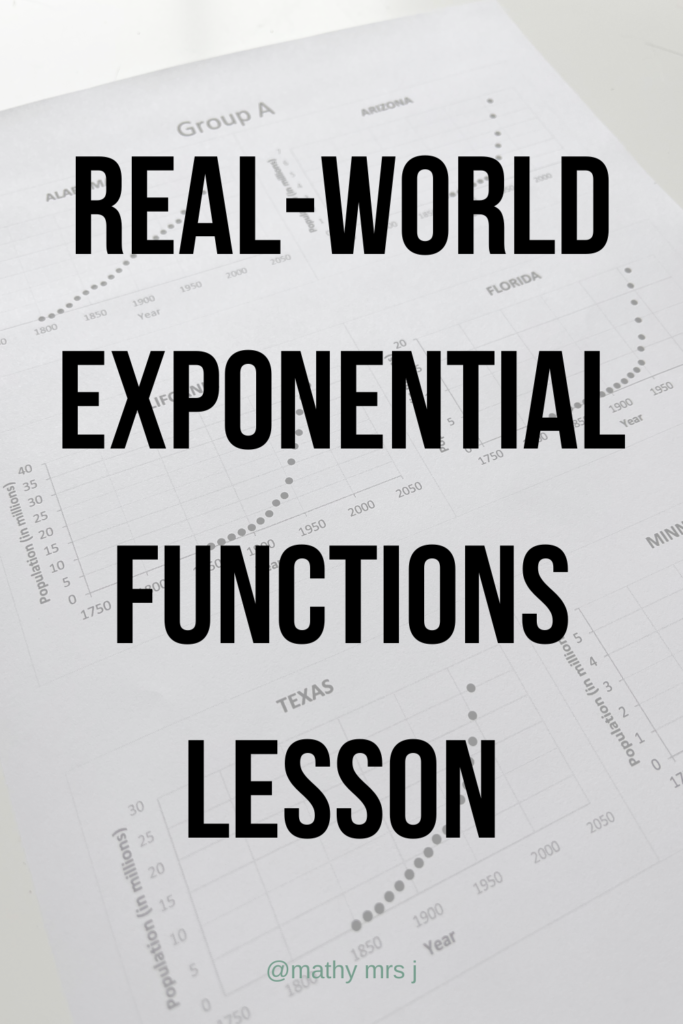
Truth be told, I don’t even remember how I stumbled upon the state population data. All I know is that it is the PERFECT match for teaching students the difference between linear and exponential functions, and it’s positively dripping with real-world connections. I geek out about it every year I teach it! Basically, some state’s populations have grown at a relatively constant rate (ahem, linearly), and some have grown exponentially. I give students a scatter plot of a state’s population over time and ask them to sort the states into two categories. This low-floor entry allows all my students to grasp the difference (visually at least) between linear and exponential situations.
Want access to my FREE resource library? Click here to join!
The Lesson: Compare Linear and Exponential Functions
Because my students had prior knowledge of arithmetic and geometric sequences, they could calculate the common difference or common ratio (whichever was appropriate) for the state population data. This allowed them to see whether the data represented a linear function with a common difference/constant rate of change, or an exponential function with a common ratio/increasing rate of change. Additionally, students can use graphing calculators or other technology to calculate the regression equation for the data, and analyze the r-value (or r^2 value) to see which is a better fit.
Lesson Connections
This lesson really draws in the students who are fans of history. Some state’s populations have actually decreased over certain decades and I extend the lesson by having them research why those states lost significant numbers of people. For example, Kansas’ population decreased in the 1930’s because of the Great Depression and the Dust Bowl. Since I teach in Kansas we have a great conversation about our grandparents and great-grandparents and their experiences during that era. I like to draw a connection between real people’s lives and the scatter plot. It’s not just a dot on a graph; it represents people’s lives and those people were possibly even related to us!
I wasn’t kidding when I said I geek out about this lesson, haha! I have dreams of teaching a cross curricular unit of The Grapes of Wrath, US History, and this math lesson. If you, too, want to provide students a non-fake, real-world example to compare linear and exponential functions click here to buy this lesson from my TpT store. Read more about my real-world lessons for radical functions, trigonometric functions, or finding the area of a sector.
Don’t forget to request access to my FREE resource library – click here!
Happy teaching!
Natasha